I gathered these insights from various studies, which covered businesses of different sizes from different industries. Some of these insights may suit most businesses, while others don’t.
These insights are available on many websites and widely shared on social media. However, not all of these insights are available at a single source and in a format that marketers and businesses can easily incorporate into their strategy.
It is a lengthy blog post. Here are the highlights:
- 2X – ROI is high with short-term marketing. However, long-term marketing can generate 2X the profit from short-term marketing alone.
- 1.6X – Combining reach (awareness) and performance marketing strategies increases the large business effects (profit and market share) by 1.6X
- ~95% – At any point in time, approximately 95% of the target audience is out-market. Most audiences develop brand favorability before they reach the purchase stage. You will leave money to your competitors if you target only the in-market audience.
- ~60% of sales come from long-term marketing and ~40% from short-term marketing. It varies for different industries and companies.
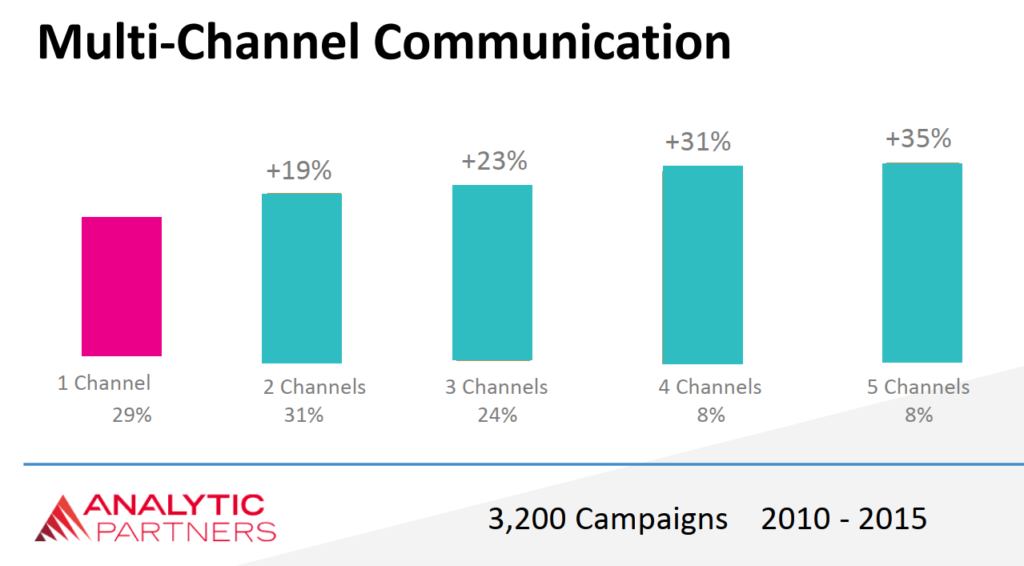
- 135% – Increasing channels leads to incremental ROI, starting from 119% for 2 channels to 135% for 5 channels.
- Total profit efficiency is highest for online video channels among the digital channels.
- 18 – brand size and market share have the highest profit multiplier (18) followed by creative execution (12).
- 47% – creative contributes to the highest (47%) campaign effectiveness, followed by reach (22%)
- Channels and ads that hold audience attention for more time (measured as Active Attention Seconds – AAS) increase mental availability, which has a strong relationship with market share. TV ads followed by YouTube ads provide the highest AAS, but Meta ads are the cost-effective followed by YouTube ads.
Many startups commonly ignore some of these insights. For example, long-term marketing is considered either a waste of money or a strategy meant only for big brands. Instead of depending only on click-based attribution, which alone can’t measure the larger impact of long-term marketing initiatives, startups should either build the capabilities to measure the impact of long-term marketing or outsource it.
Note:
- The research reports empower marketers with valuable insights. However, consumer behavior is rapidly changing in the digital era. Marketing strategies and models that worked a few years ago may not work today. The Excess Share of Voice model, which I explained in the last section of this post, is one such example. Your marketing strategy should be based on insights specific to your business.
- Another example is the effect of digital transformation. According to a study1 conducted by Harvard Business Review, covering 80 global banks, digital leaders who embraced digital and A.I. innovations grew digital sales from 40% to 70% (from 2018 to 2022), while digital laggards grew from 8% to 17%.
Consistent research and running experiments would help you drive large business effects.
Key factors that drive large business results
Top drivers of profit and ROI
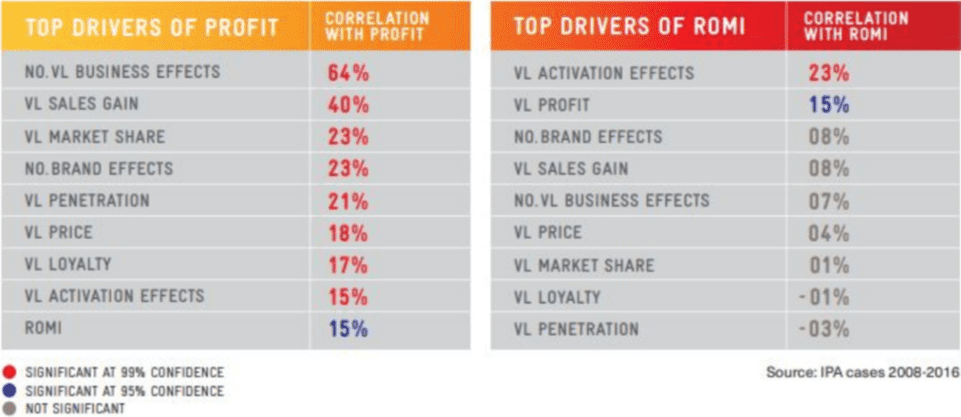
Image source: 2
Trade-off between brand and performance marketing for different channels
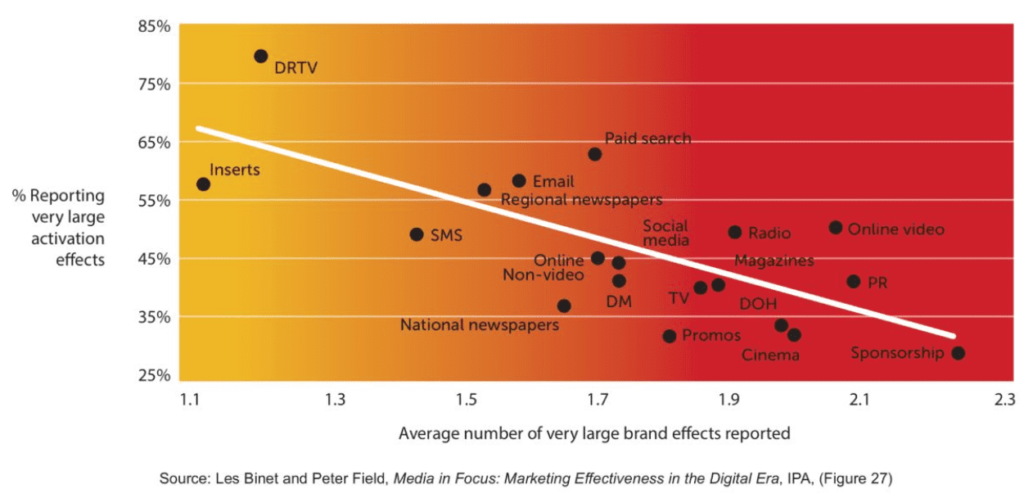
Image source: 3
Short-term marketing boosts ROI but not profit
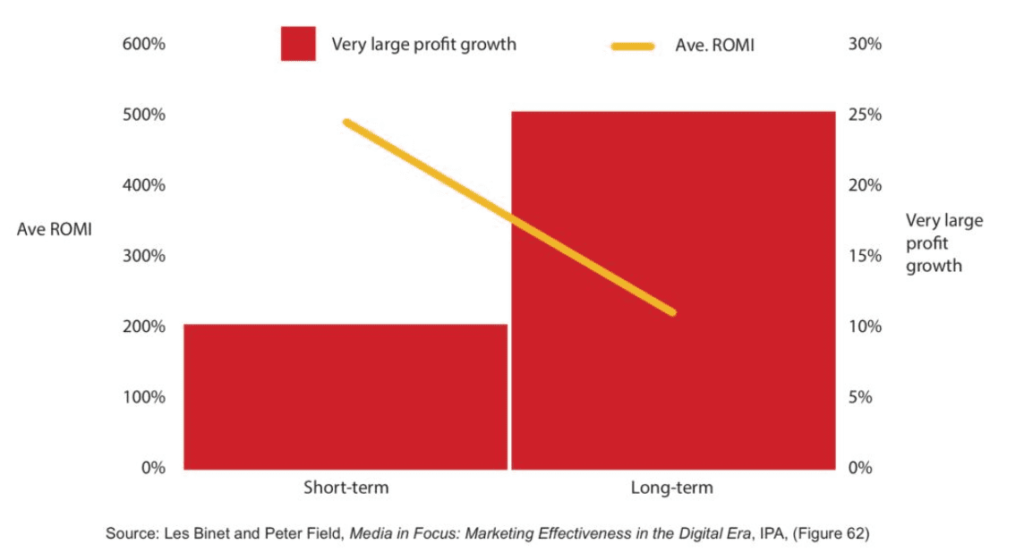
Image source: 4
Share of Voice vs Share of Market
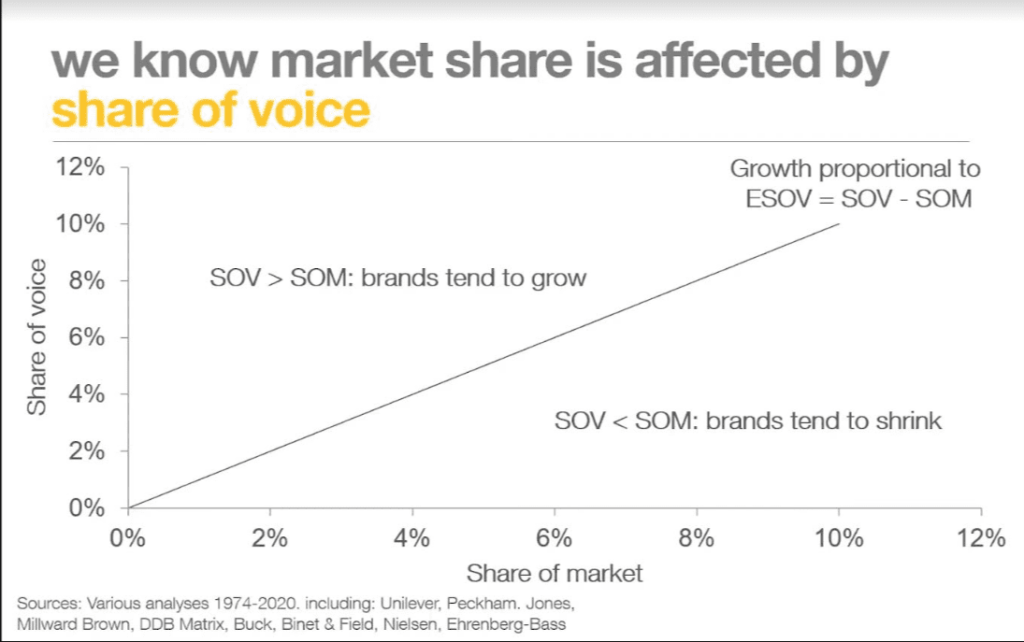
Image source: 5
Gain of market share with Excess Share of Voice (ESOV) vs. brand size.
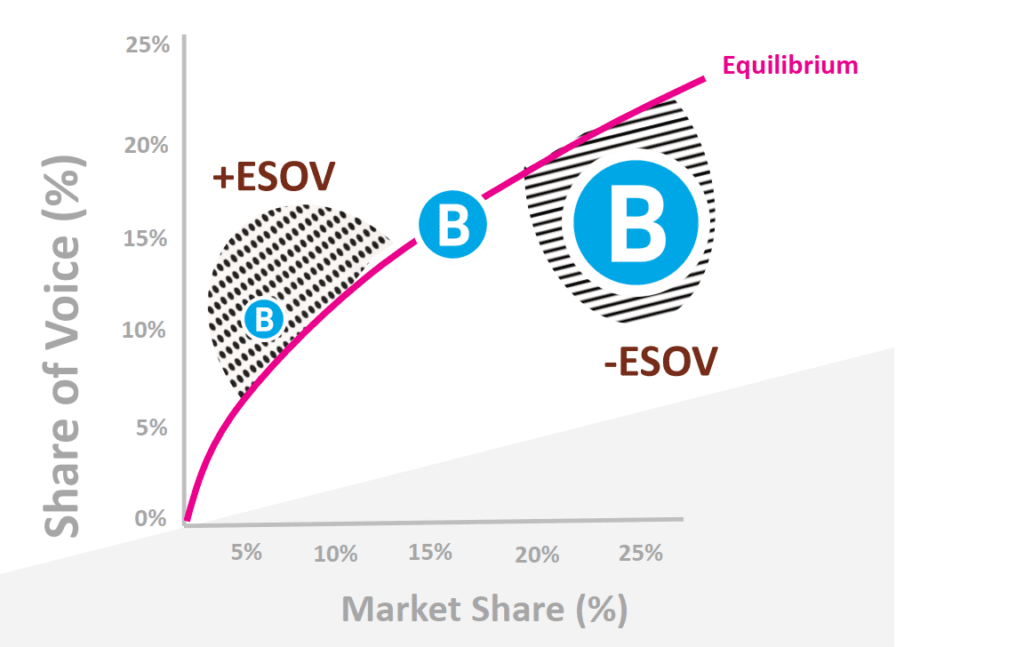
Image source: 6
Excess Share of Voice and large business effects

Image source: 7
ESOV efficiency by industry
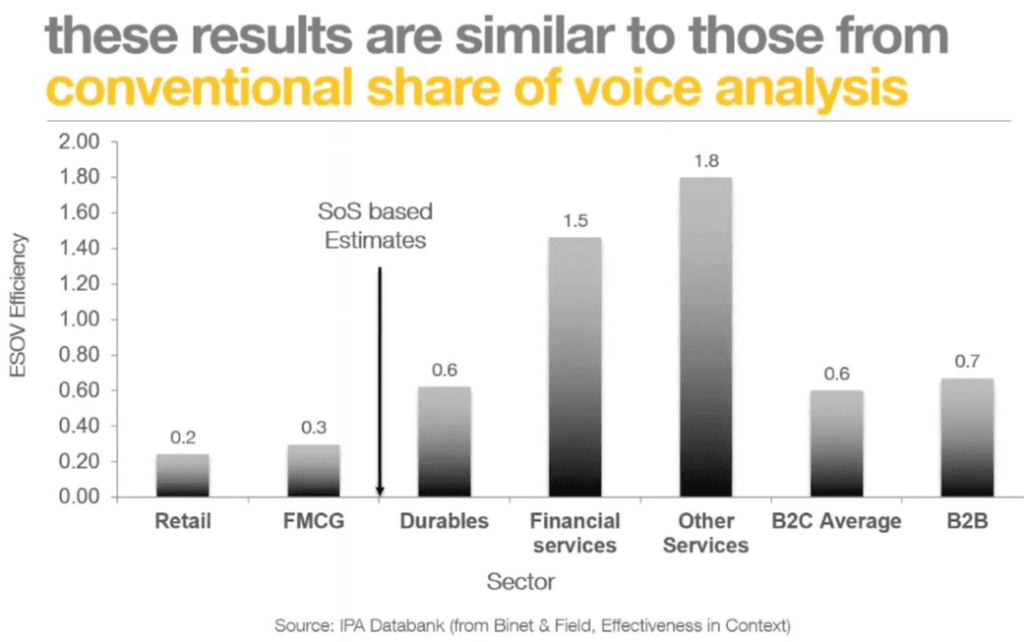
Image source: 8
Mental Market Share vs Market Share of insurance companies in Australia
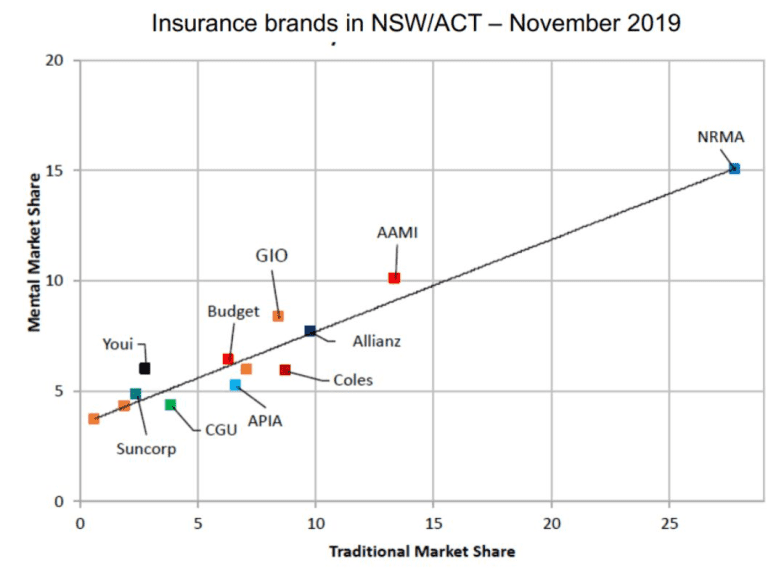
Image source: 9
Targeting existing and/or new customers vs business results
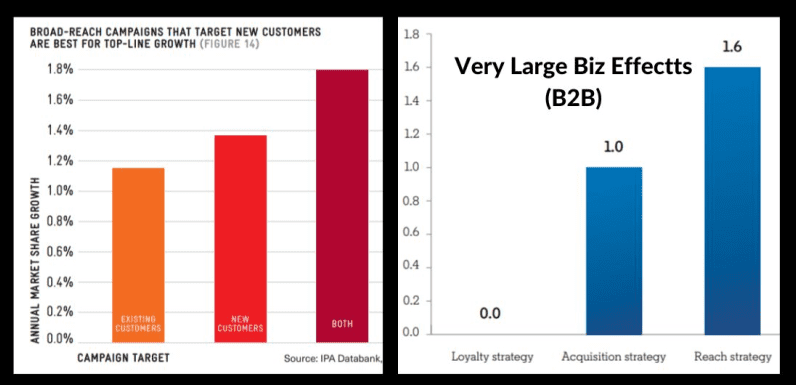
Image source: 10
Effectiveness of using owned, paid, and earned media combined vs separately
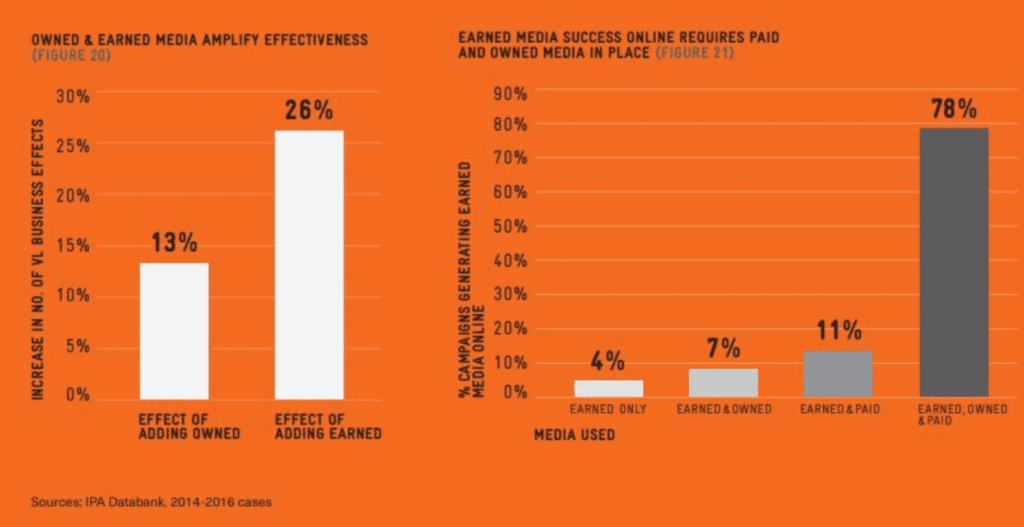
Image source: 11
Rational vs. emotional communication and performance vs. brand

Image source: 12
Rational vs. emotional communication in B2B

Image source: 13
Brand marketing vs. performance marketing
Impact of brand marketing investment in the short-term and long-term
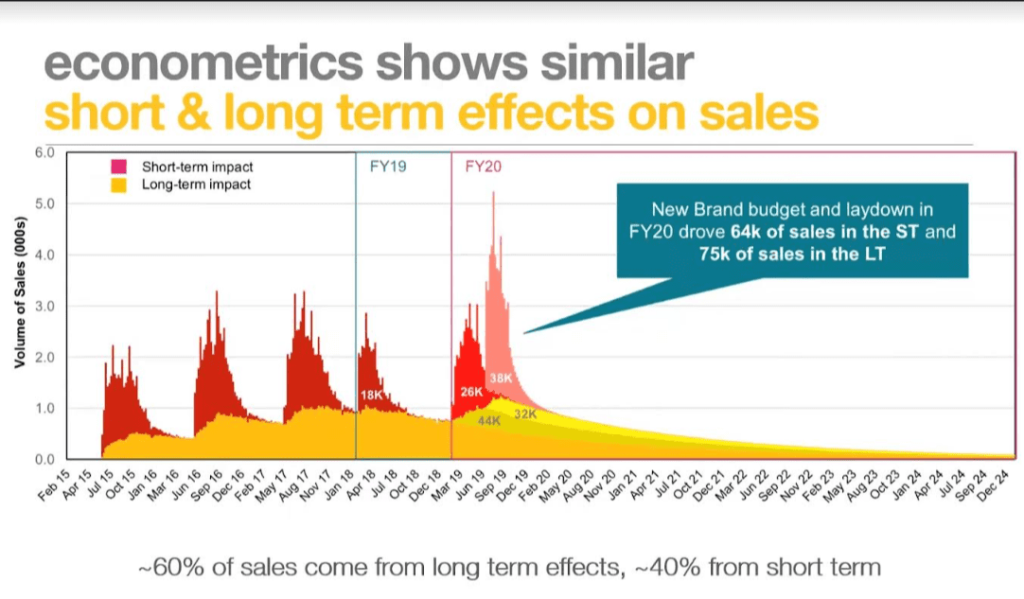
Image source: 14
Ideal brand vs. performance marketing budget split for different industries
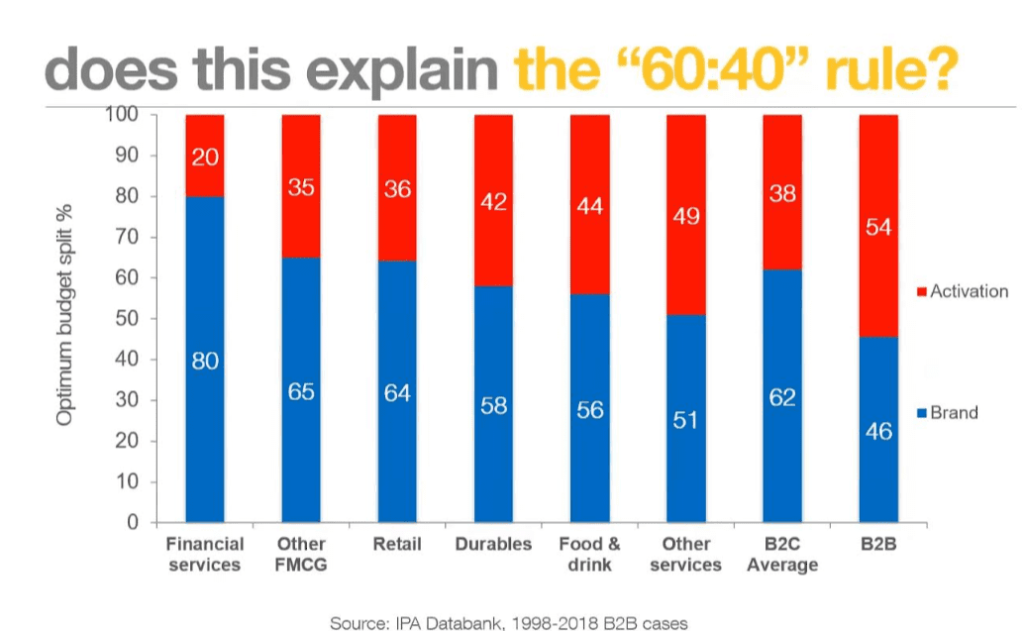
Image source: 15
The long-term multiplier of brand marketing investment
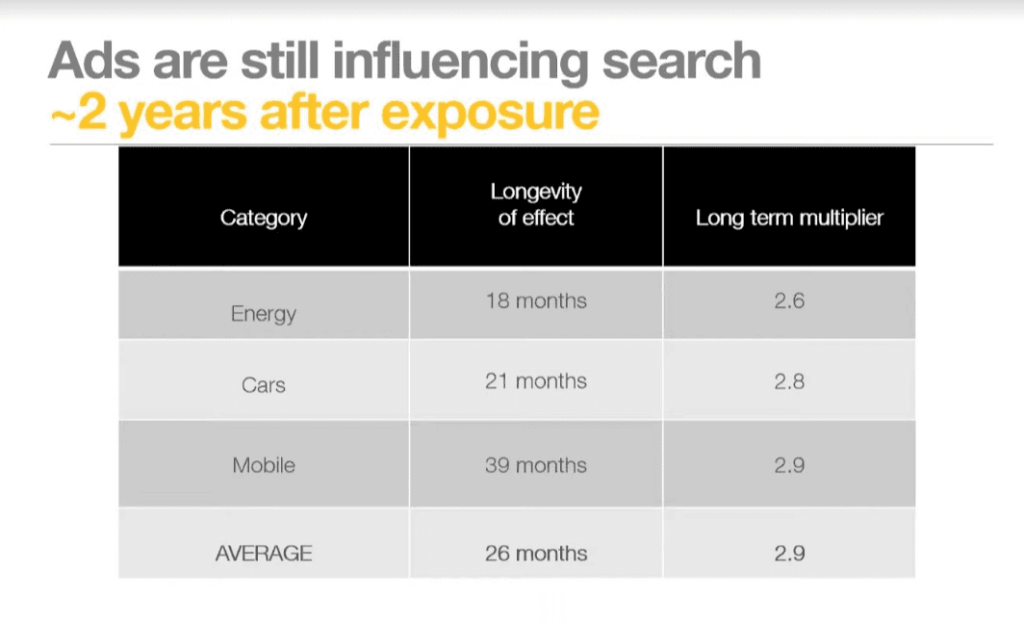
Image source: 16
Channel mix
Incremental ROI of adding additional channels
Proportion of advertising-generated profit by medium
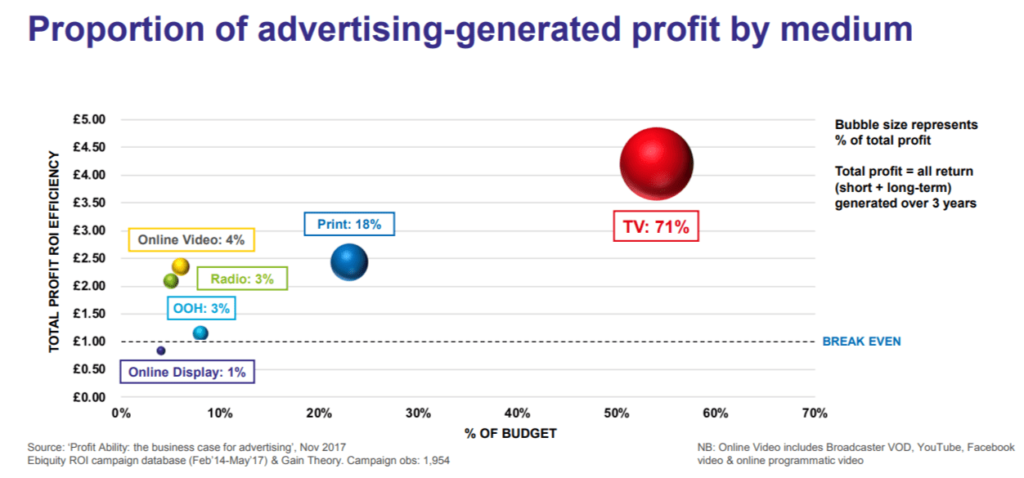
Image source: 17
Incremental sales: TV vs. YouTube

Source: 18
Long-term and short-term ROI of digital advertising
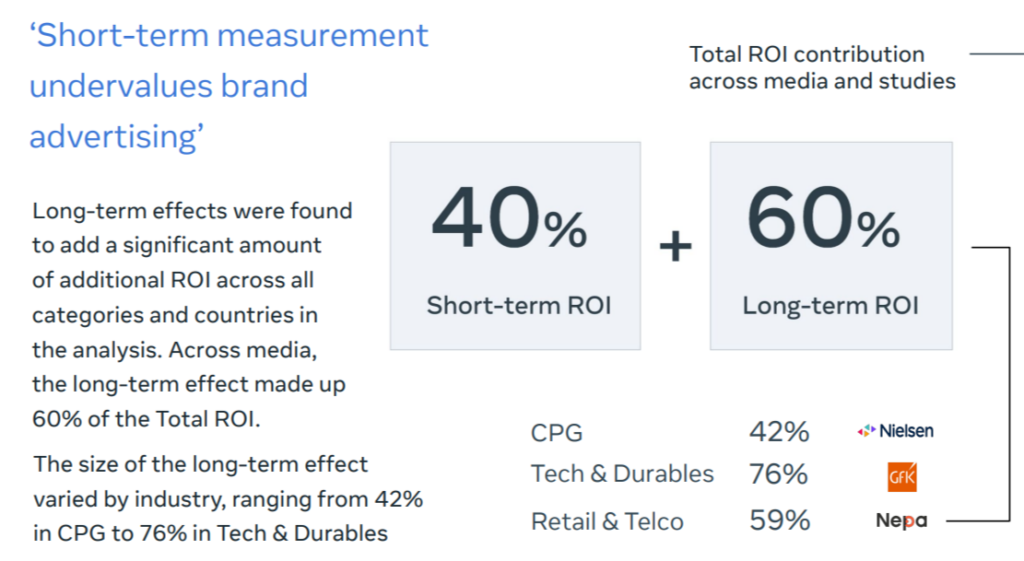
Source: 19
CPG industry
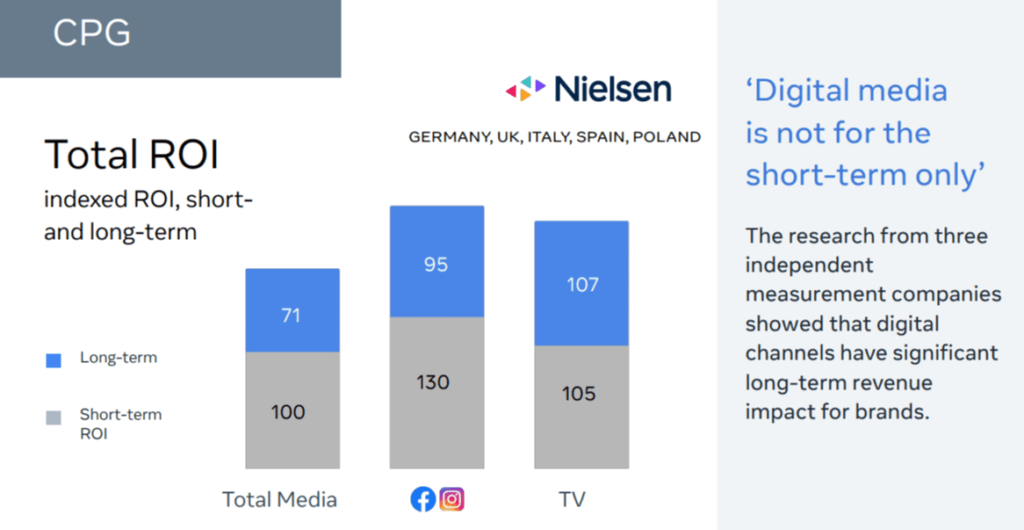
Source: 20
Retail and Telco industries
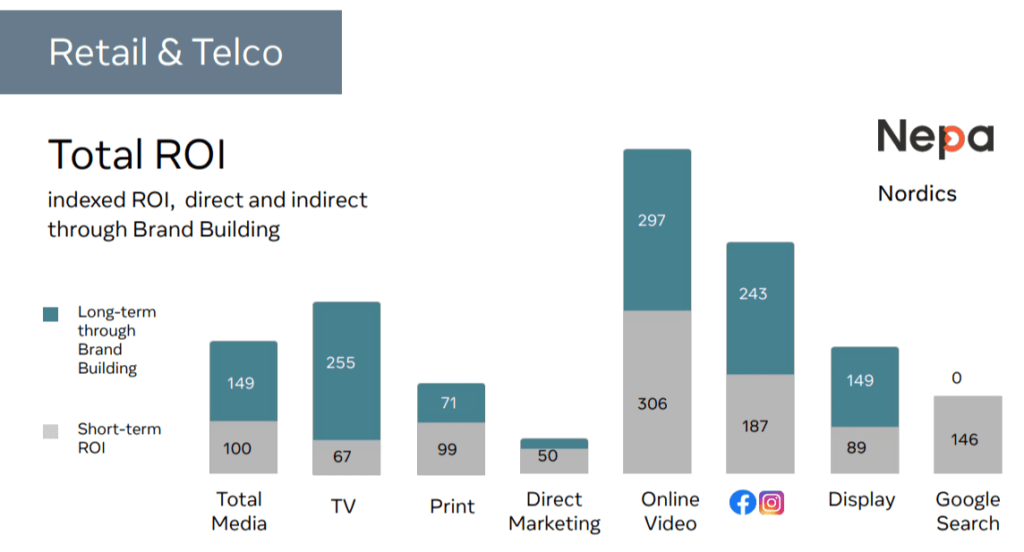
Source: 21
Tech and Durable industries
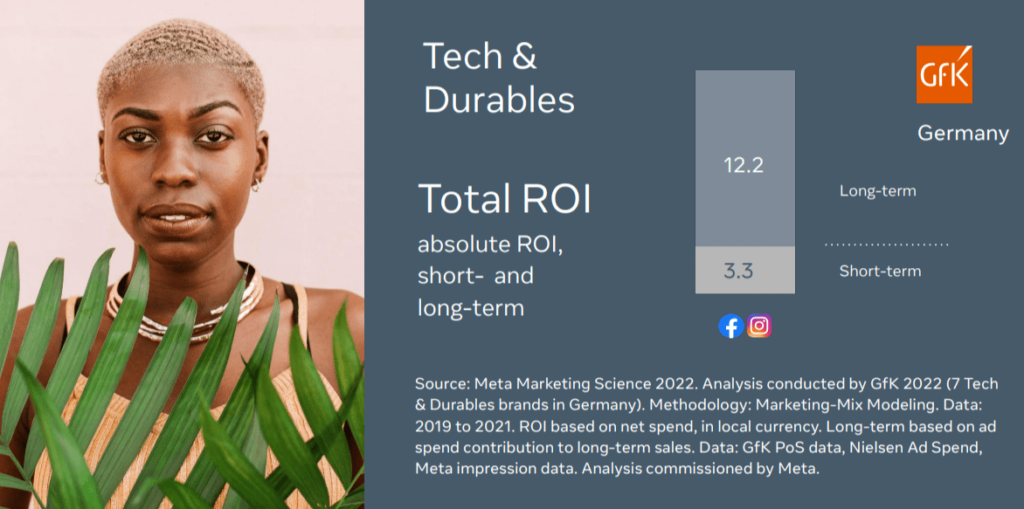
Source: 22
Campaign and creative mix
The top 10 factors driving advertising profitability
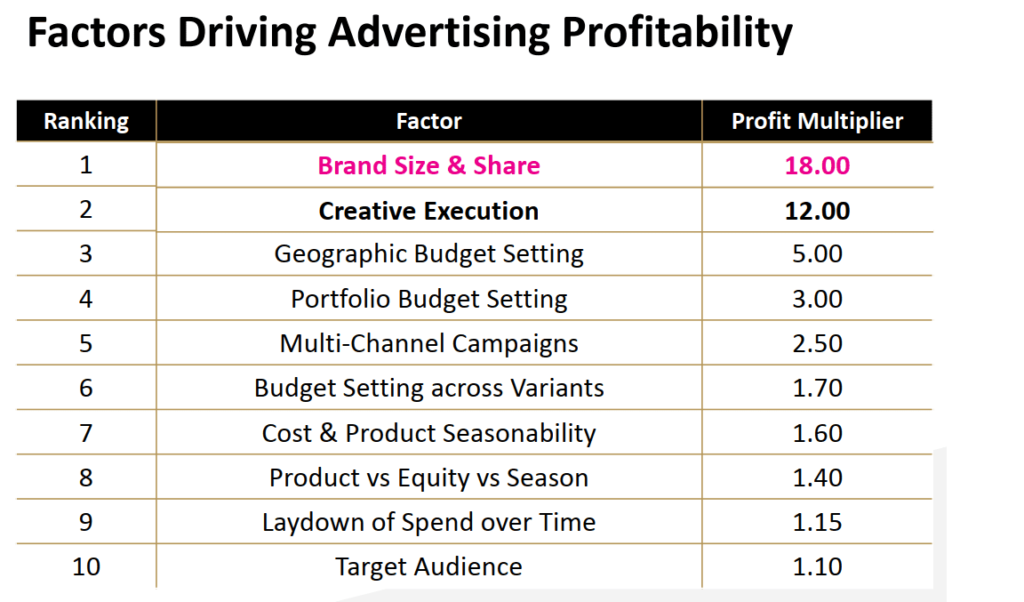
Image Source: 23
The relative contributing power of different elements of a campaign
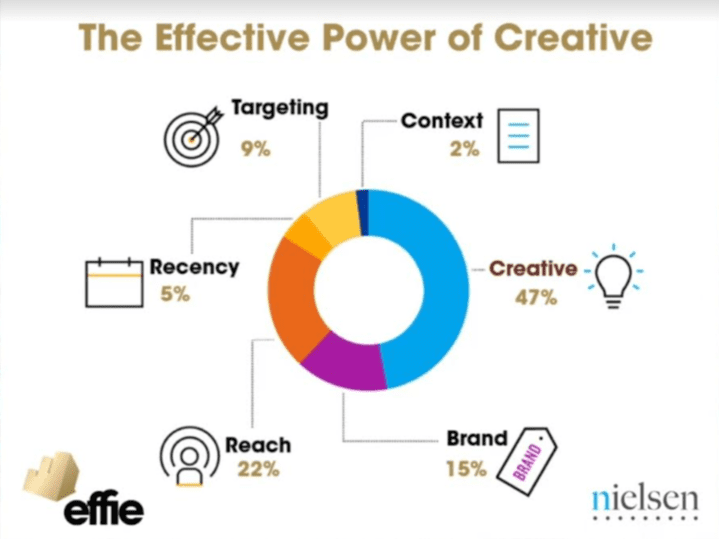
Image Source: 24
Alternatives to Excess Share of Voice (ESOV)
Share of Voice (SOV) is the share of your advertising spend compared to your competitors. Excess Share of Voice (ESOV) = Share of Voice – Market Share (SOM).
Two decades ago, the media mix mainly consisted of traditional media like TV, print, and radio. A 10% increase in the ESOV was expected to increase SOM by 0.5%, depending on the brand’s category and size. However, in this digital era, the ESOV vs. SOM model may not be reliable for the following reasons:
Measuring SOV and ESOV was easier with traditional media, where the media spending of competitors was more transparent. It is becoming difficult to measure ESOV in the digital era.
Not all media impressions are equal. There is now a huge difference in the impact of each impression from channel to channel.
Attention seconds vs. Mental Availability vs. Market Share
In a study25 conducted by Amplified Intelligence, channels and ads that hold audience attention for more time (measured as attention seconds) increase mental availability. As shown in the findings mentioned above, there is a strong relationship between mental availability and market share.
According to System1 research26, a video ad creates an impact only once it hits 2.5 seconds of view time (Active Attention Seconds – AAS). TV ads hit the highest AAS. A 15-second TV ad hits 7.5 attention seconds, and a non-skippable YouTube ad hits 5.2 attention seconds.
According to the study27 jointly conducted by OMD, Yahoo, and Amplified Intelligence, while AAS is highest on Connected TV (CTV), personal devices are better for conversion.
Audiences exposed to a brand’s ad had a higher purchase intent on mobile (+26%) than on desktop (+13%) and CTV (+11%), compared to those not exposed to the brand’s ad.
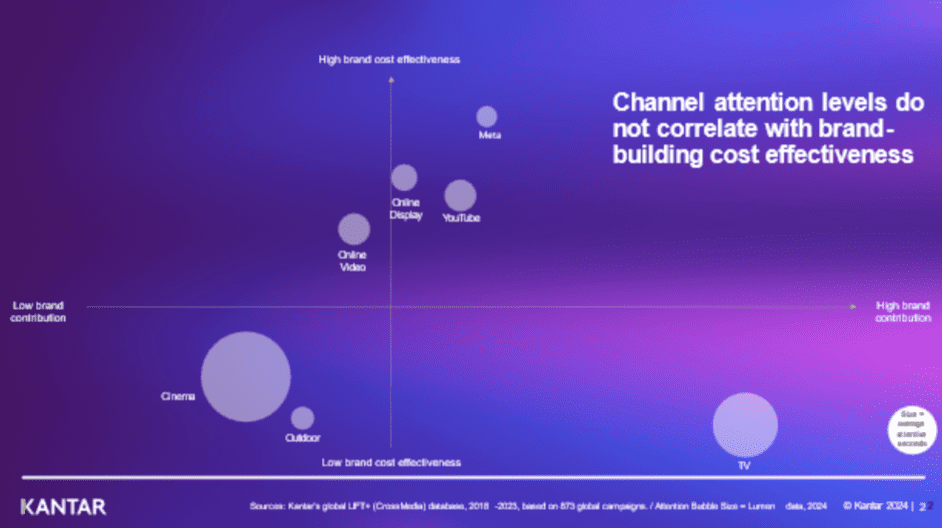
Image Source: 28
However, we need to consider the cost-effectiveness of AAS on these channels. Kantar came up with relative cost-effectiveness of channels based on Kantar’s global LIFT+ database of cross-media effectiveness.
Meta has the highest brand contribution vs. high brand cost-effectiveness followed by YouTube/Onine Display.
It suggests a balanced channel mix and a balanced mix of attention levels to achieve media effectiveness.
Fame-driving campaigns

Image Source: 29
Les Binet and Peter Field define fame as “not simply about generating brand awareness. It is about building word-of-mouth advocacy for the brand – getting it talked about, creating authority for the brand and the sense that it is making most of the running in the category.”
Fame-driving campaigns drive large improvements in all business metrics including ESOV. Measuring brand fame or attention used to be challenging, but it seems easier now.
While Active Attention Seconds helps you choose the right channel and media format, Fame-Model helps you choose the type of campaign.
Share of Search (SOS)
Share of Search (SOS) is the percentage of search volume captured by a brand or a product in its category or industry.
SOS is not an alternative but a proxy metric to SOV because SOS is not an input. Selecting channels with high AAS and budget allocation are inputs. However, SOS can be used as a predictive metric.

Image Source: 30
Share of Search (SOS) vs. Share of Market (SOM)
As the changes in the SOS precede changes in the SOM, you can observe the changes in the SOS and make changes to the marketing strategy in advance to meet the planned SOM objective.
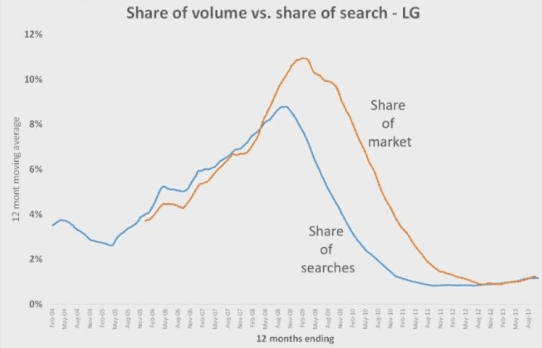
Image Source: 31
Footnotes
- The Value of Digital Transformation by Harvard Business Review: https://hbr.org/2023/07/the-value-of-digital-transformation
- Media in focus marketing effectiveness in the digital era: https://screenforce.nl/wp-content/uploads/2017/10/20171023-Media-in-focus-marketing-effectiveness-in-the-digital-era.pdf
- Media in focus marketing effectiveness in the digital era: https://screenforce.nl/wp-content/uploads/2017/10/20171023-Media-in-focus-marketing-effectiveness-in-the-digital-era.pdf
- Media in focus marketing effectiveness in the digital era: https://screenforce.nl/wp-content/uploads/2017/10/20171023-Media-in-focus-marketing-effectiveness-in-the-digital-era.pdf
- The Long and Short of It by Les Binet and Peter Field: https://ipa.co.uk/knowledge/documents/the-long-and-the-short-of-it-presentation
- Effectiveness - The Top 10 Drivers by Think Tv: https://thinktv.ca/wp-content/uploads/2019/11/ThinkTV-ritson_summary.pdf
- TO ESOV AND BEYOND Selected charts: https://thinktv.com.au/wp-content/uploads/2021/07/To-ESOV-and-Beyond-selected-slides.pdf
- Effectiveness in Context - A manual for brand building by Les Binet and Peter Field: https://downloads.ctfassets.net/ptzdhtf6t0jg/7hlC0oHJIdCqATrkrKINKT/246b2755a78a7872b8e75389aab5203f/Effectiveness_In_Context.pdf
- Effectiveness in Context - A manual for brand building by Les Binet and Peter Field: https://downloads.ctfassets.net/ptzdhtf6t0jg/7hlC0oHJIdCqATrkrKINKT/246b2755a78a7872b8e75389aab5203f/Effectiveness_In_Context.pdf
- Media in focus marketing effectiveness in the digital era: https://screenforce.nl/wp-content/uploads/2017/10/20171023-Media-in-focus-marketing-effectiveness-in-the-digital-era.pdf
- Media in focus marketing effectiveness in the digital era: https://screenforce.nl/wp-content/uploads/2017/10/20171023-Media-in-focus-marketing-effectiveness-in-the-digital-era.pdf
- Media in focus marketing effectiveness in the digital era: https://screenforce.nl/wp-content/uploads/2017/10/20171023-Media-in-focus-marketing-effectiveness-in-the-digital-era.pdf
- Media in focus marketing effectiveness in the digital era: https://screenforce.nl/wp-content/uploads/2017/10/20171023-Media-in-focus-marketing-effectiveness-in-the-digital-era.pdf
- The Long and Short of It by Les Binet and Peter Field: https://ipa.co.uk/knowledge/documents/the-long-and-the-short-of-it-presentation
- The Long and Short of It by Les Binet and Peter Field: https://ipa.co.uk/knowledge/documents/the-long-and-the-short-of-it-presentation
- The Long and Short of It by Les Binet and Peter Field: https://ipa.co.uk/knowledge/documents/the-long-and-the-short-of-it-presentation
- Profit Ability: the business case for advertising, Novermber 17: https://thinktv.ca/wp-content/uploads/2018/08/thinktv_Nick_Manning_ProfitAbility.pdf
- YouTube advertisers, focus on these 4 key drivers of ROI: https://www.thinkwithgoogle.com/intl/en-apac/marketing-strategies/data-and-measurement/video-advertising-roi-on-youtube/
- The short- and long-term impact of advertising.pptx: https://about.fb.com/wp-content/uploads/2022/07/The-short-and-long-term-impact-of-advertising.pptx.pdf
- The short- and long-term impact of advertising.pptx: https://about.fb.com/wp-content/uploads/2022/07/The-short-and-long-term-impact-of-advertising.pptx.pdf
- The short- and long-term impact of advertising.pptx: https://about.fb.com/wp-content/uploads/2022/07/The-short-and-long-term-impact-of-advertising.pptx.pdf
- The short- and long-term impact of advertising.pptx: https://about.fb.com/wp-content/uploads/2022/07/The-short-and-long-term-impact-of-advertising.pptx.pdf
- Effectiveness - The Top 10 Drivers by Think Tv: https://thinktv.ca/wp-content/uploads/2019/11/ThinkTV-ritson_summary.pdf
- When it comes to advertising effectiveness, what is key?: https://www.nielsen.com/insights/2017/when-it-comes-to-advertising-effectiveness-what-is-key/
- Attention and Mental Availability bu Professor Karen Nelson-Field: https://www.amplifiedintelligence.com.au/wp-content/uploads/2022/07/Amplified-Intelligence-Attention-and-Mental-Availability.pdf
- Peter Field: Marketers are too disinvested in TV advertising: https://www.marketingweek.com/peter-field-tv-underpriced/
- New global research reveals dynamics of consumer attention and business outcomes: https://www.advertising.yahooinc.com/post/new-global-research-reveals-dynamics-of-consumer-attention-and-business-outcomes
- How attention impacts media and creative effectiveness: https://www.kantar.com/inspiration/advertising-media/how-attention-impacts-media-and-creative-effectiveness
- The short- and long-term impact of advertising.pptx: https://about.fb.com/wp-content/uploads/2022/07/The-short-and-long-term-impact-of-advertising.pptx.pdf
- The short- and long-term impact of advertising.pptx: https://about.fb.com/wp-content/uploads/2022/07/The-short-and-long-term-impact-of-advertising.pptx.pdf
- The short- and long-term impact of advertising.pptx: https://about.fb.com/wp-content/uploads/2022/07/The-short-and-long-term-impact-of-advertising.pptx.pdf